Dashboard Overview
The Stackly Dashboard is your central hub for monitoring usage, managing resources, and tracking team activity.
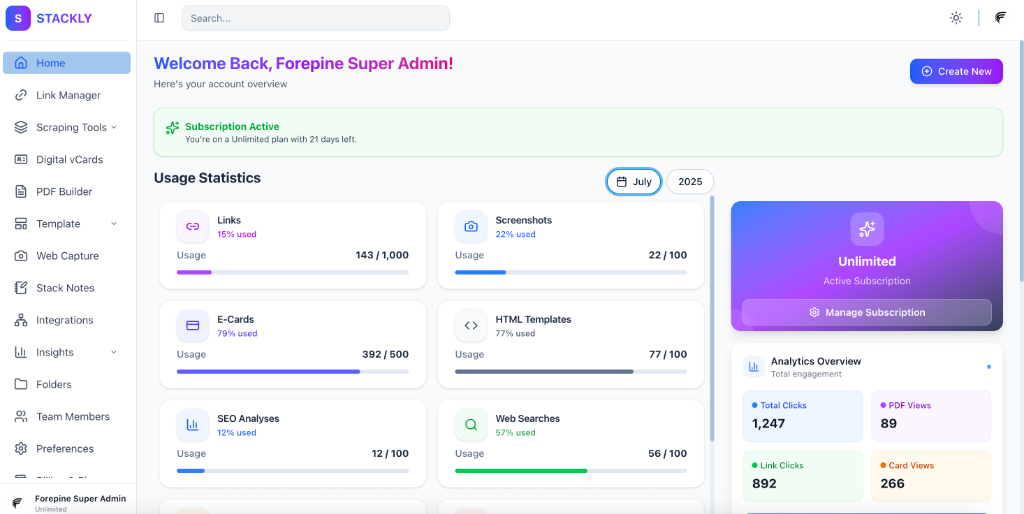
Usage Statistics
Get a real-time view of your consumption across all Stackly services. The dashboard displays usage metrics for:
- Links: Number of short links created vs. your plan limit.
- Screenshots: Count of web captures generated.
- Digital vCards: Active digital business cards.
- HTML Scraper: Number of scraping requests processed.
- PDFs: Documents generated via Web to PDF.
- Stack Notes: Active notes and tasks.
- Team Members: User seats occupied in your organization.
Historical Data
Analyze your usage trends over time.
- Locate the Date Picker dropdown in the Usage Statistics section.
- Select a specific Month and Year.
- The dashboard will update to show the usage data for that selected period, allowing you to track growth and plan for future needs.